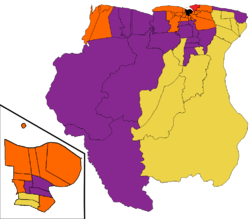
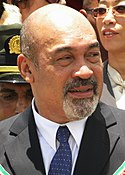
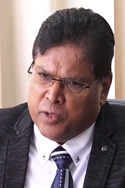
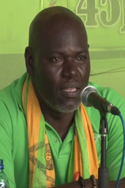
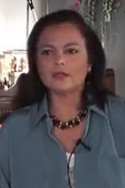
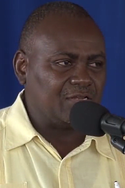
De Surinaamse parlementsverkiezingen 2020 zijn gehouden op 25 mei 2020. Bij parlementsverkiezingen in Suriname worden de 51 leden van De Nationale Assemblée (DNA) gekozen. In werkelijkheid zijn de parlementsverkiezingen een verzameling van meerdere lokale verkiezingen: de 51 zetels worden over de 10 districten van Suriname verdeeld. Het aantal zetels per district is vastgelegd in de grondwetswijziging van 1987. De partij die uiteindelijk de meeste zetels weet te winnen, mag de regering vormen. Op 16 juli 2020 is Chan Santokhi geïnstalleerd als president.
Deelnemende partijen
Peilingen
885px
| Datum |
Bureau |
VHP |
NDP |
NPS |
ABOP |
PL |
HVB |
BEP |
A20 |
DOE |
overig |
Voorsprong
|
| Uitslag 2020 |
OKB |
39,45% |
23,97% |
11,79% |
9,08% |
6,05% |
2,70% |
2,49% |
1,64% |
0,86% |
3,31% |
+15,48%
|
| 3e prognose |
Consulytic |
44,10% |
23,20% |
10,17% |
5,47% |
7,69% |
2,96% |
2,09% |
0,25% |
0,76% |
3,31% |
+20,90%
|
| 2e prognose |
NIKOS |
39,23% |
29,41% |
7,84% |
15,69% |
1,96% |
0,48% |
3,92% |
0,48% |
0,48% |
0,51% |
+9,82%
|
| 1e prognose |
NIKOS |
38,24% |
30,39% |
7,23% |
16,67% |
1,19% |
1,96% |
2,11% |
0,36% |
1,19% |
0,66% |
+7,85%
|
| 20-02-2020 |
IDOS |
27,26% |
27,83% |
17,50% |
11,91% |
2,87% |
2,15% |
5,02% |
0,87% |
2,87% |
0,82% |
+0,57%
|
| 07-04-2019 |
NIKOS |
30,10% |
31,10% |
16,20% |
11,30% |
5,00% |
0,79% |
0,40% |
- |
1,00% |
4,11% |
+1,00%
|
| 12-02-2018 |
IDOS |
37,81% |
35,69% |
8,00% |
3,00% |
4,00% |
2,00% |
5,00% |
- |
2,00% |
2,50% |
+2,12%
|
| 01-12-2017 |
IDOS |
35,52% |
32,35% |
9,95% |
6,33% |
3,62% |
2,94% |
3,62% |
- |
2,71% |
2,96% |
+3,17%
|
| 01-01-2016 |
IDOS |
34,19% |
34,00% |
9,54% |
4,97% |
6,76% |
- |
1,59% |
- |
7,36% |
1,59% |
+0,19%
|
| Uitslag 2015 |
BiZa |
18,65% |
45,46% |
4,15% |
10,45% |
10,36% |
- |
4,13% |
- |
0,67% |
6,13% |
+26,81%
|
Verkiezingsuitslag
Landelijk
% = Percentage van het totaal aantal stemmen
◉ = Aantal zetels
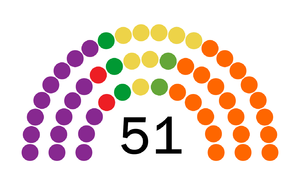
Samenstelling van De Nationale Assemblée (DNA) na de Surinaamse parlementsverkiezingen van 2020.
| Partij |
Lijsttrekker |
2015 |
2020 |
Verschil
|
| % |
◉ |
% |
◉ |
% |
◉
|
|
Vooruitstrevende Hervormingspartij |
VHP |
Chan Santokhi |
18,65% |
9 |
39,45% |
20 |
+20,80% |
+11
|
|
Nationale Democratische Partij |
NDP |
Desi Bouterse |
45,46% |
26 |
23,97% |
16 |
-21,49% |
-10
|
|
Nationale Partij Suriname |
NPS |
Gregory Rusland |
4,15% |
2 |
11,79% |
3 |
+7,64% |
+1
|
|
Algemene Bevrijdings- en Ontwikkelingspartij |
ABOP |
Ronnie Brunswijk |
10,45% |
5 |
9,08% |
8 |
-1,37% |
+3
|
|
Pertjajah Luhur |
PL |
Paul Somohardjo |
10,36% |
5 |
6,05% |
2 |
-4,31% |
-3
|
|
Hervormings- en Vernieuwingsbeweging |
HVB |
Mike Noersalim |
- |
- |
2,70% |
0 |
+2,70% |
0
|
|
Broederschap en Eenheid in de Politiek |
BEP |
Ronny Asaniba |
4,13% |
2 |
2,49% |
2 |
-1,64% |
0
|
|
Alternatief 2020 |
A20 |
Steven Reyme |
- |
- |
1,64% |
0 |
+1,64% |
0
|
|
Democratie en Ontwikkeling in Eenheid |
DOE |
Steven Alfaisi |
4,31% |
1 |
0,86% |
0 |
-3,45% |
-1
|
|
Progressieve Arbeiders- en Landbouwersunie |
PALU |
Jim Hok |
0,67% |
1 |
0,30% |
0 |
-0,37% |
-1
|
|
overige partijen |
1,82% |
0 |
1,67% |
0 |
-0,15% |
0
|
| totaal |
100,00% |
51 |
100,00% |
51 |
± 65,56%* |
± 30*
|
* verschuiving van stem- en zetelverhoudingen t.o.v. 2015
Regionaal
Hieronder volgen de verkiezingsuitslagen per district.
% = Percentage van het totaal aantal stemmen
◉ = Aantal zetels
Paramaribo
VHP
NDP
NPS
ABOP
DOE
PL
SDU
|
|
| Partij |
2015 |
2020 |
Verschil
|
| % |
◉ |
% |
◉ |
% |
◉
|
|
Vooruitstrevende Hervormingspartij |
VHP |
8,21% |
2 |
33,53% |
7 |
+25,32% |
+5
|
|
Nationale Democratische Partij |
NDP |
49,26% |
9 |
25,50% |
5 |
-23,76% |
-4
|
|
Nationale Partij Suriname |
NPS |
8,21% |
2 |
18,72% |
3 |
+10,51% |
+1
|
|
Algemene Bevrijdings- en Ontwikkelingspartij |
ABOP |
8,11% |
1 |
10,07% |
2 |
+1,96% |
+1
|
|
overige partijen |
26,21% |
3 |
12,36% |
0 |
-13,58% |
-3
|
| totaal |
100,00% |
17 |
100,00% |
17 |
± 75,13% |
± 14
|
|
Wanica
VHP
NDP
PL
|
|
| Partij |
2015 |
2020 |
Verschil
|
| % |
◉ |
% |
◉ |
% |
◉
|
|
Vooruitstrevende Hervormingspartij |
VHP |
37,62% |
3 |
57,95% |
5 |
+20,33% |
+2
|
|
Nationale Democratische Partij |
NDP |
37,34% |
3 |
16,19% |
1 |
-21,15% |
-2
|
|
Pertjajah Luhur |
PL |
12,54% |
1 |
11,86% |
1 |
-0,86% |
0
|
|
overige partijen |
12,50% |
0 |
14,00% |
0 |
+1,50% |
0
|
| totaal |
100,00% |
7 |
100,00% |
7 |
± 43,84% |
± 4
|
|
Nickerie
VHP
NDP
PL
|
|
| Partij |
2015 |
2020 |
Verschil
|
| % |
◉ |
% |
◉ |
% |
◉
|
|
Vooruitstrevende Hervormingspartij |
VHP |
37,47% |
2 |
59,65% |
4 |
+22,16% |
+2
|
|
Nationale Democratische Partij |
NDP |
38,69% |
2 |
22,94% |
1 |
-15,75% |
-1
|
|
overige partijen |
23,84% |
1 |
17,43% |
0 |
-6,43% |
-1
|
| totaal |
100,00% |
5 |
100,00% |
5 |
± 43,43% |
± 4
|
|
Coronie
NDP
PALU
|
|
| Partij |
2015 |
2020 |
Verschil
|
| % |
◉ |
% |
◉ |
% |
◉
|
|
Nationale Democratische Partij |
NDP |
45,89% |
1 |
56,73% |
2 |
+10,84% |
+1
|
|
overige partijen |
54,11% |
1 |
43,27% |
0 |
-10,84% |
-1
|
| totaal |
100,00% |
2 |
100,00% |
2 |
± 21,68% |
± 2
|
|
Saramacca
VHP
NDP
PL
|
|
| Partij |
2015 |
2020 |
Verschil
|
| % |
◉ |
% |
◉ |
% |
◉
|
|
Vooruitstrevende Hervormingspartij |
VHP |
23,72% |
1 |
53,91% |
2 |
+30,19% |
+1
|
|
Nationale Democratische Partij |
NDP |
43,89% |
1 |
28,42% |
1 |
-15,47% |
0
|
|
overige partijen |
32,39% |
1 |
17,67% |
0 |
-14,72% |
-1
|
| totaal |
100,00% |
3 |
100,00% |
3 |
± 60,38% |
± 2
|
|
Commewijne
VHP
NDP
PL
|
|
| Partij |
2015 |
2020 |
Verschil
|
| % |
◉ |
% |
◉ |
% |
◉
|
|
Vooruitstrevende Hervormingspartij |
VHP |
18,83% |
1 |
43,66% |
2 |
+24,83% |
+1
|
|
Nationale Democratische Partij |
NDP |
43,97% |
2 |
23,73% |
1 |
-20,24% |
-1
|
|
Pertjajah Luhur |
PL |
18,82% |
1 |
19,49% |
1 |
+0,66% |
0
|
|
overige partijen |
18,38% |
0 |
12,12% |
0 |
-6,26% |
0
|
| totaal |
100,00% |
4 |
100,00% |
4 |
± 51,99% |
± 2
|
|
Marowijne
ABOP
NDP
|
|
| Partij |
2015 |
2020 |
Verschil
|
| % |
◉ |
% |
◉ |
% |
◉
|
|
Algemene Bevrijdings- en Ontwikkelingspartij |
ABOP |
55,02% |
2 |
63,85% |
2 |
+8,83% |
0
|
|
Nationale Democratische Partij |
NDP |
34,60% |
1 |
23,12% |
1 |
-11,48% |
0
|
|
overige partijen |
10,35% |
1 |
13,03% |
0 |
+2,68% |
0
|
| totaal |
100,00% |
3 |
100,00% |
3 |
± 22,99% |
± 0
|
|
Para
NDP
ABOP
|
|
| Partij |
2015 |
2020 |
Verschil
|
| % |
◉ |
% |
◉ |
% |
◉
|
|
Nationale Democratische Partij |
NDP |
65,90% |
3 |
40,39% |
2 |
-25,51% |
-1
|
|
Algemene Bevrijdings- en Ontwikkelingspartij |
ABOP |
9,66% |
0 |
16,96% |
1 |
+7,30% |
+1
|
|
overige partijen |
24,44% |
1 |
42,65% |
0 |
+18,21% |
0
|
| totaal |
100,00% |
3 |
100,00% |
3 |
± 51,02% |
± 2
|
|
Brokopondo
NDP
ABOP
BEP
|
|
| Partij |
2015 |
2020 |
Verschil
|
| % |
◉ |
% |
◉ |
% |
◉
|
|
Nationale Democratische Partij |
NDP |
49,24% |
2 |
33,75% |
1 |
-15,49% |
-1
|
|
Algemene Bevrijdings- en Ontwikkelingspartij |
ABOP |
1,81% |
0 |
33,68% |
1 |
+31,87% |
+1
|
|
Broederschap en Eenheid in de Politiek |
BEP |
45,36% |
1 |
22,97% |
1 |
-22,39% |
0
|
|
overige partijen |
3,59% |
0 |
9,60% |
0 |
+6,01% |
0
|
| totaal |
100,00% |
3 |
100,00% |
3 |
± 75,76% |
± 2
|
|
Sipilawini
ABOP
NDP
BEP
|
|
| Partij |
2015 |
2020 |
Verschil
|
| % |
◉ |
% |
◉ |
% |
◉
|
|
Algemene Bevrijdings- en Ontwikkelingspartij |
ABOP |
25,15% |
1 |
35,87% |
2 |
+10,72% |
+1
|
|
Nationale Democratische Partij |
NDP |
51,97% |
2 |
28,49% |
1 |
-23,48% |
-1
|
|
Broederschap en Eenheid in de Politiek |
BEP |
19,92% |
1 |
17,68% |
1 |
-2,24% |
0
|
|
overige partijen |
2,96% |
0 |
17,96% |
0 |
+15,00% |
0
|
| totaal |
100,00% |
4 |
100,00% |
4 |
± 51,44% |
± 2
|
|
